Currently you can only monitor one value on screen at a time. For example you can see the note values change but you can’t simultaneosly see the velocity values or the filter cutoff. It would be cool to have a dashboard page to watch and track all the changing values. This can help to relate a number to a sound and better understand how parameters influence and relate one another.
What is the problem?
You can only track one value on screen at a given time.
What do you want to achieve?
I’d like to option to see a collection of common and essential values visualized on screen as a display type option.
Are there any workarounds?
no
Any links to related discussions?
no
Any references to other products?
Surely there are some but the display for the Rossum Control Forge comes to mind. It tracks and visualizes several numerical and musical values in real time as a display option. Also Synthesis Technologies e352 has some visualization options which aren’t exactly what I am asking for but certainly a cool way to show music on a screen. I am more interested in just seeing a grid with many categories and changing values.
- https://www.rossum-electro.com/products/control_forge/
- Synthesis Technology - Eurorack E352
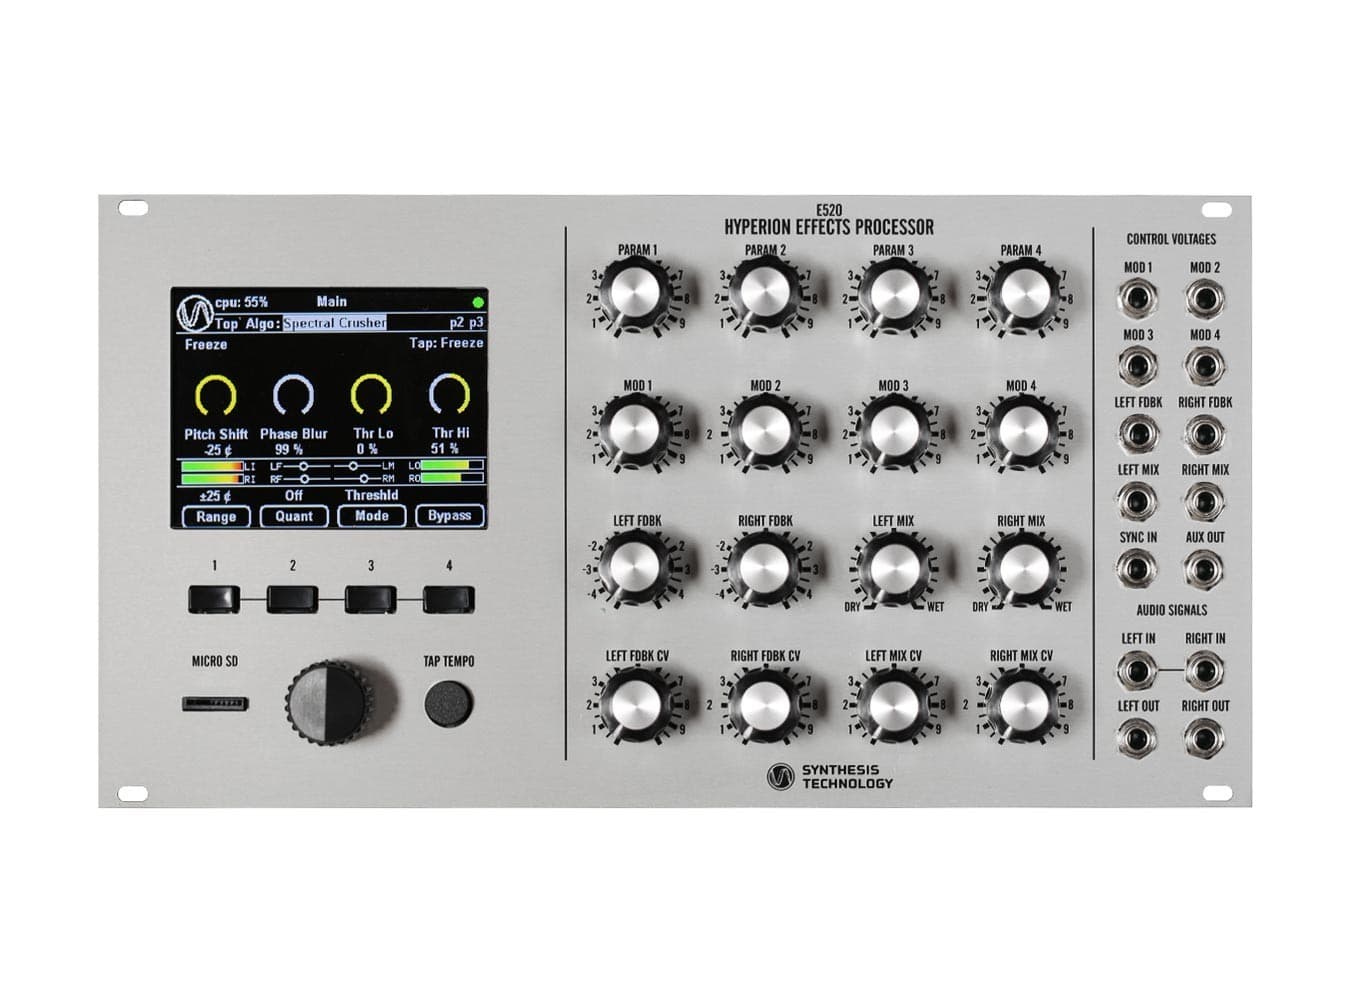
There are many visual examples for data visualization such as iot dashboards. Here is an example of the dashboard on the e520. Of course on the play there could be many more values tracked on screen and I feel it would be quite informative for connecting numbers to sounds.